
Porirua house prices momentarily overtake Wellington City; A wider structural shift in the region?
June 2, 2026
Wellington Property Insights Report
March 2026.
A collaboration between Comprendé and The Property Knowledge.
Executive summary:
Porirua’s median house price briefly overtaking Wellington City in early 2026 is more than a statistical curiosity – it reflects a moment where cyclical forces and emerging structural dynamics intersect.
The crossover raises a central question for the region: is Wellington City experiencing a temporary softening driven by affordability pressures and resilience related constraints, or is Porirua consolidating a longer‑term shift in its relative market position?
Drawing on updated data across prices, rents, population flows, and new supply, this report evaluates whether the region is undergoing a short-term recalibration or a more durable rebalancing.
The evidence points to a cyclical adjustment with structural undertones, rather than a permanent inversion of the regional hierarchy. Porirua’s momentum is genuine – supported by new‑build activity, demographic change, and strong value‑for‑money dynamics – while Wellington City’s median is being temporarily held down by insurance, seismic, and liquidity constraints.
The crossover is meaningful, but not definitive. It signals a market in transition rather than a completed structural shift.
House prices:
The latest data show a clear divergence in district level performance. Porirua momentarily moved ahead of Wellington City on median price measures, supported by strong buyer demand, limited available stock, and sustained interest in family‑sized homes with good transport access.
Wellington City, by contrast, has experienced a softer price trajectory through the higher interest rate cycle. Resilience‑related constraints – including insurance costs, seismic strengthening requirements, and a bifurcated apartment market – have tempered price growth even as underlying demand remains intact.
Nationally, similar patterns have been observed: suburban and satellite markets often outperform central cities when affordability pressures rise and households seek more space. Porirua’s recent performance aligns with this broader trend.
Whether this relative outperformance persists will depend on how buyers weigh affordability, transport connectivity, and long-term economic opportunities. The data suggest that Porirua’s gains are partly structural, but Wellington City retains the deeper economic base that typically reasserts itself over the medium term.
Figure 1: Wellington House Price by District and Total for the Region (Oct 2025 to Apr 2026)
Rents:
Rental conditions remain firm across the region, with Porirua consistently recording some of the highest weekly rents. This reflects strong tenant demand from households priced out of ownership and those seeking larger suburban homes.
Wellington City’s rental market has shown more volatility, with a period of easing followed by a recovery through early 2026. This pattern reflects shifting tenant preferences, increased apartment supply, and uncertainty in public sector employment – all of which influence central‑city rental dynamics.
Despite this volatility, Wellington City remains the region’s rental anchor. Its role as the primary employment and education hub continues to underpin demand, even when house prices soften. The resilience of the rental market reinforces the view that Wellington City’s recent price movements are cyclical rather than structural.
Figure 2: Wellington rent trends by district (Mar 2025-Mar 2026)
Population trends
Population movements continue to explain much of the variation in district level housing outcomes. Between 2024 and 2025, Wellington City recorded a modest population decline of around 800 residents, while Lower Hutt gained a similar number. Other districts remained broadly stable.
This redistribution reflects affordability pressures and evolving work patterns, with some households relocating to more affordable or family-oriented districts. These patterns mirror national and international trends observed since the pandemic, where remote work and transport flexibility have reshaped location choices.
However, the scale of Wellington City’s population decline remains modest. Global evidence suggests that large cities typically regain population momentum over time due to agglomeration effects, employment concentration, and amenity advantages. The recent shift is therefore best interpreted as a temporary decentralisation rather than a sustained outward migration.
Figure 3: Wellington population by district (2024-2025)
Earnings, income, and affordability
Wellington City continues to record some of the highest household incomes in New Zealand due to its concentration of government, professional, and knowledge sector employment (Stats NZ, 2024). This strong income base underpins long‑term housing demand, even when short‑term conditions soften.
Affordability pressures remain elevated, however. Wellington City’s house‑price‑to‑income ratio sits above 8 – higher than in surrounding districts – limiting borrowing capacity and helping explain the city’s more subdued price growth through the recent cycle (OECD, 2023; Demographia, 2024). By contrast, districts with lower entry prices relative to incomes, such as Lower Hutt and Upper Hutt, have shown stronger momentum.
While recent public‑sector restructuring may have temporarily dampened demand, Wellington City remains the region’s economic anchor. Surrounding districts continue to benefit from households retaining Wellington‑based incomes while relocating to lower‑cost markets – a pattern consistent with affordability‑driven decentralisation.
Overall, the evidence suggests recent demand shifts reflect relative affordability pressures, not fundamental changes in income distribution (Reserve Bank of New Zealand, 2024). As financial conditions stabilise, Wellington City’s higher income base is likely to reassert itself as a key driver of long-term housing demand.
New housing supply
New residential construction has slowed across the Wellington region, with most districts now recording fewer than 30 monthly consents. Wellington City, which peaked at around 140 annual consents earlier, has also seen activity moderate as higher construction costs, tighter development finance, and softer resale values reduce feasibility (Reserve Bank of New Zealand, 2024; MBIE, 2024).
Townhouses and other medium density projects remain central to long‑term supply but are particularly sensitive to end‑sale pricing and margin compression in the current market. Feasibility is strongest in locations with planning certainty, infrastructure capacity, and reliable transport access, leading to increasingly uneven development outcomes across districts (OECD, 2023).
Given these conditions, new build delivery is likely to remain selective in the near term, reinforcing existing differences in housing supply and market performance across the region.
Figure 4: Wellington number of new residential consents – 5 districts (Mar 2025 to Mar 2026)
Yields:
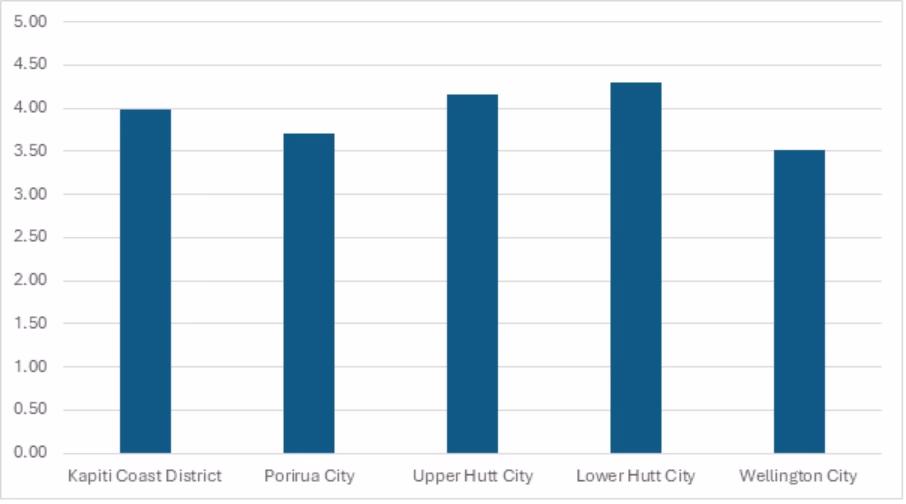
Gross rental yields continue to vary across the Wellington region and remain shaped more by movements in capital values than by changes in weekly rents. The latest data show Lower Hutt recording the highest yields at 4.30%, followed closely by Upper Hutt at 4.15%, reflecting lower entry prices and steady rental demand.
Kapiti Coast sits mid‑range at 3.98%, while Porirua records a yield of 3.71%, balancing comparatively high rents with elevated median prices. Wellington City shows the lowest yield in the region at 3.52%, consistent with its historically stronger capital growth, higher-value housing stock, and diversified economic base.
If capital values rise faster than rents in the next phase of the cycle, yields are likely to compress further – particularly in districts where prices have already rebounded.
For investors, higher yields in outer districts often compensate for greater exposure to cyclical demand shifts, while Wellington City’s lower yields reflect its long-term stability and deeper economic fundamentals.
Table 1: Rents, house Prices, and income yield for Wellington at district level
| District | Rents – Mar 2026 $ per Week | House Prices – Mar 2026 $ Median | Income Yields % Mar 2026 |
| Kapiti Coast District | 600 | 783,000 | 3.98 |
| Porirua City | 650 | 910,000 | 3.71 |
| Upper Hutt City | 615 | 770,000 | 4.15 |
| Lower Hutt City | 595 | 720,000 | 4.30 |
| Wellington City | 585 | 865,000 | 3.52 |
Figure 5: Income yield % for Wellington at district level – Mar 2026
New build and townhouses – viability
New build activity, including townhouses and other medium density developments, remains central to Wellington’s future housing supply, particularly as planning frameworks continue to support urban intensification. However, viability has become increasingly constrained.
Elevated construction costs, higher development finance pricing, infrastructure contributions, and softer resale values are compressing margins across both standalone homes and townhouse projects, with the latter especially sensitive to end sale pricing (Reserve Bank of New Zealand, 2024; MBIE, 2024).
Feasibility is currently strongest in locations where land can be efficiently assembled, density optimised, and transport access supports sustained buyer demand. Development outcomes are becoming more location specific, favouring areas with planning certainty, infrastructure capacity, and clear market depth (OECD, 2023).
Given these conditions, new build delivery is likely to remain selective in the near term, resulting in uneven supply responses across the region and reinforcing existing differences in market performance.
Transport and transit
Transport connectivity remains a central driver of housing demand across the Wellington region. Districts with reliable commuting access into Wellington City continue to attract households seeking lower housing costs while maintaining proximity to employment and services.
Improvements in roading, rail reliability, and public transport frequency can directly influence housing demand and location choice. Enhanced accessibility effectively expands the metropolitan labour market catchment and is typically capitalised into property values (OECD, 2020).
Recent evidence confirms that transport accessibility remains a key determinant of spatial housing outcomes, shaping both property values and household location decisions (OECD, 2023). Districts with dependable transport links tend to show more resilient demand, particularly during periods of affordability pressure.
While improved transport connections can support short-term decentralisation, they also reinforce Wellington City’s role as the region’s primary employment hub. Over time, accessibility improvements strengthen economic linkages rather than permanently displace the core.
After the floods: Wellington property values and insurance
Climate related risk is becoming an increasingly important influence on property values and housing demand across the Wellington region. Recent flood events have heightened buyer awareness of exposure to coastal and inundation hazards, with rising insurance premiums and more restrictive coverage directly affecting affordability and market liquidity (Reserve Bank of New Zealand, 2023).
Post event evidence shows that climate shocks can shape sale prices, rental yields, and insurers’ willingness to underwrite certain properties. These risks are now more explicitly reflected in pricing and lending decisions as households and institutions adjust to evolving risk profiles (Ministry for the Environment, 2024).
As a result, insurance availability and climate exposure are becoming more significant differentiators across suburbs, adding an additional layer of uncertainty when assessing long-term housing market trends.
Summary
Porirua’s recent outperformance reflects a blend of cyclical and structural influences, including affordability pressures, shifting household preferences, and the relative feasibility of development under current density settings.
The broader evidence points to a period of relative adjustment rather than a lasting reshaping of the regional hierarchy, with Wellington City retaining the deeper economic and employment base that typically reasserts itself over time.
As conditions stabilise and supply responds, some rebalancing is likely, and Wellington City’s recent softness is best understood as a cyclical recalibration rather than a structural decline.
References
Stats NZ (2024) Household income statistics and regional data. Wellington: Stats NZ.
OECD (2020) Transport Infrastructure Investment: Bridging Divides. Paris: OECD Publishing.
OECD (2023) Housing Market Developments and Policy Implications. Paris: OECD Publishing.
Demographia (2024) International Housing Affordability Report. Demographia.
Reserve Bank of New Zealand (2023) Climate Change and Financial Stability. Wellington: RBNZ.
Reserve Bank of New Zealand (2024) Financial Stability Report. Wellington: RBNZ.
Ministry of Business, Innovation and Employment (2024) Building and Construction Sector Trends. Wellington: MBIE.
Ministry for the Environment (2024) National Climate Change Risk Assessment and Adaptation Guidance. Wellington: MfE.
The authors

Grant Foggo, Founder & CEO, Comprende
Grant Foggo has over 20 years of experience spanning the Middle East to Asia, he brings fresh thinking, entrepreneurial drive, and a deep passion for human connection. His leadership is built on innovation, growth, and making real relationships the foundation of business success. He’s constantly looking for ways to do things better and believes that the best thing for business is to put people first.

Graham Squires, Director, The Property Knowledge
admin@thepropertyknowledge.co.nz
Graham Squires is a Professor of Property Studies. He is the Author of 6 books and Editor of the Property Management Journal. Graham is a Fulbright Scholar and Director of the property research company The Property Knowledge.
Disclaimer: This work is provided for general guidance and informational purposes only and does not constitute legal, financial, or professional advice. The author(s) accept no responsibility or liability for any actions taken or decisions made based on this material.
Get in touch today. Call us on (04) 384 2141 or call in and see us at 16 The Terrace, Wellington.