
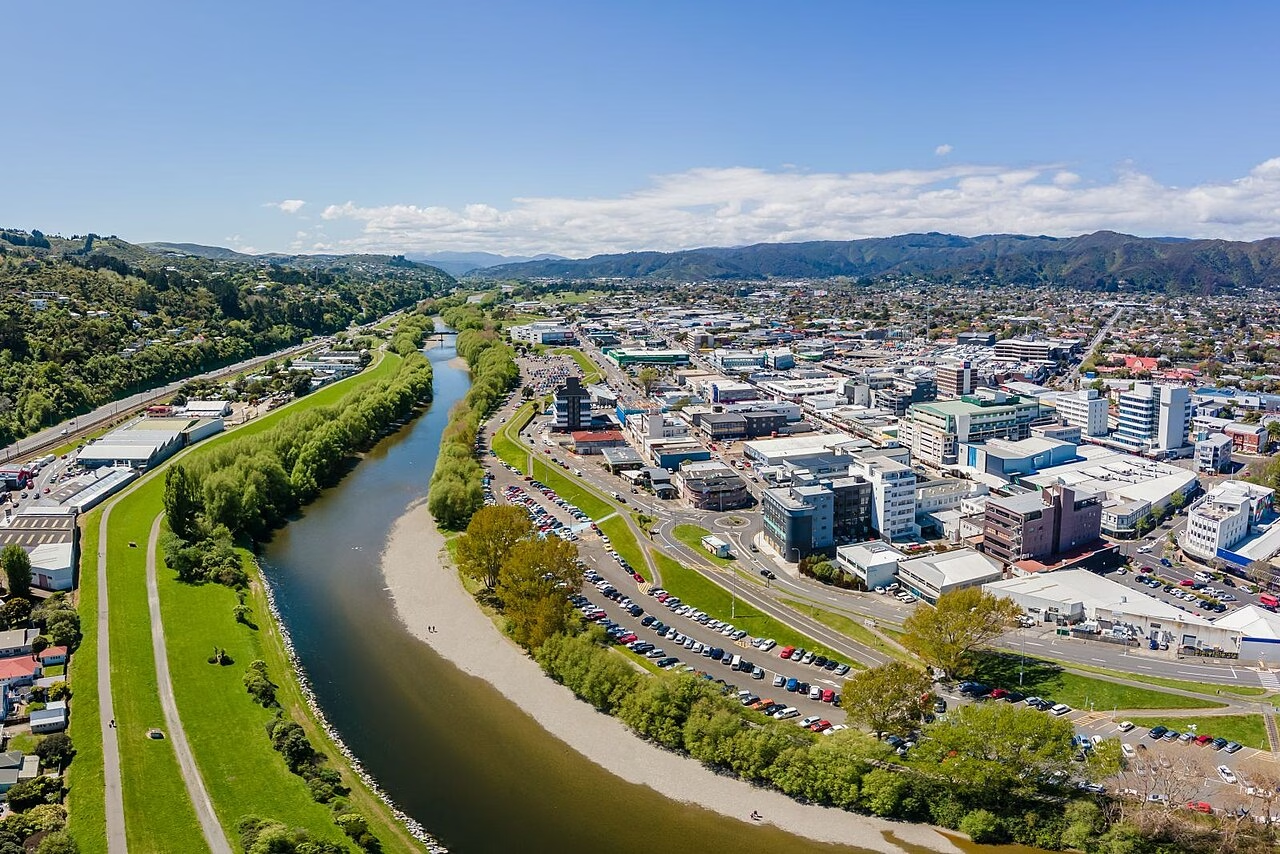
Lower Hutt tops the Wellington Property Outlook Index (POI)
September 8, 2026
Wellington Property Insights Report
September 2026.
A collaboration between Comprendé and The Property Knowledge.
Wellington Property Insights: Q3 2026
The new Property Outlook Index shows Wellington City and Lower Hutt delivering the strongest investment fundamentals in the region, with large population bases, high monthly sales activity, stable weekly rents around $590-$595, sharply reduced consents tightening future supply
Executive summary:
The introduction of the Wellington Property Outlook Index (POI) provides a step‑change in how the region is assessed, separating short‑term price performance from the deeper fundamentals that actually drive market strength. The index makes clear that strong prices alone don’t guarantee a strong outlook-this comes from population, liquidity (number of sales), rents, and supply pressure, not just recent price shifts.
The Wellington housing market remains resilient in mid‑2026, with Wellington City and Lower Hutt continuing to anchor regional strength through high demand, strong liquidity (number of sales), and stable rents.
Newbuild activity has eased sharply since 2022, tightening future supply and reinforcing favourable conditions for landlords and long‑term investors.
While Porirua showed notable price‑cycle strength in the previous report-briefly overtaking Wellington City-its lower WPOI score this quarter reflects structural factors such as smaller population and softer sales activity, rather than a reversal in price performance.
High household incomes, compressed yields, seismic‑driven insurance costs, and ongoing transport upgrades continue to shape a competitive, demand‑led regional market heading into late‑2026.
PART 1 – Wellington Property Outlook Index (POI)
Wellington Property Outlook Index (POI) – current market conditions.
Outlook: How strong is the market today?
Variables:
+ Rent
+ Supply: New Dwelling Consents
+ Demand: Population
+ Liquidity: Number of Sales
Super‑simple Outlook Index formula
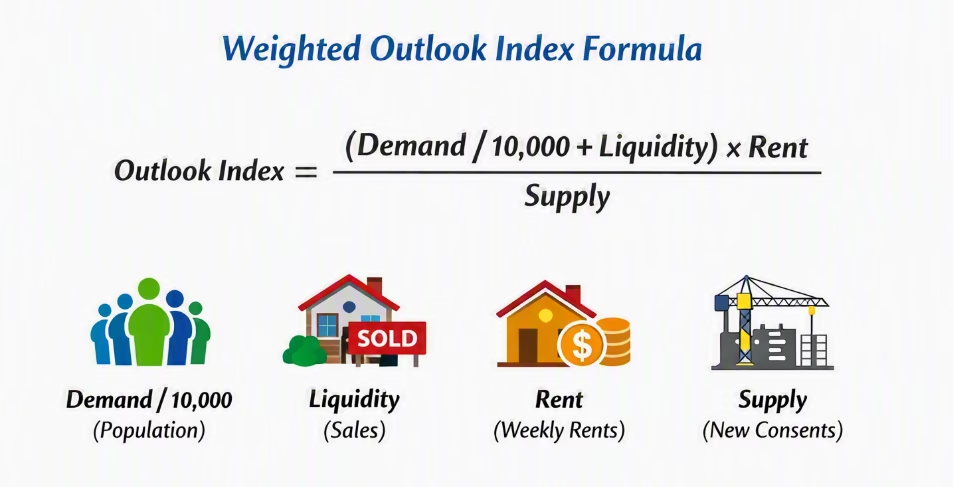
How to read the Index:
- Demand (population) pushes the index up
- Liquidity (number of sales) pushes the index up
- Rent (weekly rents) pushes the index up
- Supply (new consents) pushes the index down
This matches how people intuitively think about the market:
More buyers + more sales + higher rents + limited new building = stronger outlook.
Current outlook:
Current Index – at July 2026
| District | House Price (For Information: Not in the Index) | Weekly Rents | Supply: New Consents | Demand: Population | Liquidity: Number of Sales | Property Outlook Index |
| Lower Hutt City | 665,000 | 595 | 24 | 114200 | 118 | 283 |
| Wellington City | 840,000 | 590 | 53 | 210800 | 196 | 235 |
| Upper Hutt City | 715,000 | 610 | 16 | 47400 | 39 | 181 |
| Kapiti Coast District | 810,000 | 595 | 21 | 58000 | 63 | 165 |
| Porirua City | 835,000 | 640 | 44 | 61500 | 45 | 90 |
| Average | 750,000 | 606 | 32 | 98,380 | 92 | 186 |
Commentary:
- The Wellington region continues to show a mixed but resilient housing outlook. Districts with stronger sales activity and larger population bases-notably Lower Hutt and Wellington City-sit at the top of the index, reflecting active buyer demand and steady rental markets.
- Lower Hutt leads the pack, combining solid liquidity (sales counts) with moderate supply growth (consents), signalling a balanced yet buoyant market. Wellington City remains robust despite elevated new‑build volumes, supported by its large population and consistent rental demand.
- At the other end, Porirua and Upper Hutt record lower outlook scores, where limited sales activity and smaller population bases naturally pull down their index positions despite healthy rent levels. Kāpiti Coast sits mid‑range, its smaller scale offset by tight supply and stable rents.
- The POI makes clear that recent price performance and long‑term fundamentals are not the same thing: strong prices can lift short‑term sentiment, but the outlook is driven by population, liquidity, rents, and supply pressure.
- Overall, the average index of 186 points to a region still underpinned by demand and constrained supply.
PART 2 – What can explain the Outlook, and what else is in play?
Earnings, income
Household earnings in the Wellington region remain among the highest nationally, supported by a strong public‑sector base [1]. Median incomes continue to outpace national averages, but affordability remains stretched, with typical lending settings requiring around a $100,000 household income for a $750,000 home [1].
Yields
Rental yields across the Wellington region sit between 3.6% and 4.2%, reflecting high rents but elevated property values [2]. Wellington City’s average rent of around $590 per week keeps yields compressed relative to the Hutt Valley [2].
New build and townhouses
New dwelling consents have declined sharply since 2022, with townhouse and infill development slowing across the region [3][4]. Wellington City house prices remain down ~30% from their 2021 peak, reflecting both market cooling and reduced development feasibility [5].
Transport and transit
Transport upgrades across the Wellington region continue to support outer‑district growth, with improvements to rail and bus networks enhancing accessibility [6]. International evidence also shows that transport investment is closely tied to regional housing performance, especially in constrained geographies like Wellington [10].
Natural hazards and insurance
Wellington’s seismic profile continues to influence insurance costs, with premiums significantly higher than in most other New Zealand cities [7]. Insurers have tightened underwriting standards, with some properties facing restricted cover or elevated excesses due to hazard exposure [8].
Policy
Policy settings around zoning, density, and lending continue to shape regional housing dynamics, with declining consents reflecting both regulatory and market shifts [3][4]. National affordability, climate‑risk, and financial‑stability frameworks are increasingly influencing development feasibility and long‑term investment confidence [9][11][12].
What this outlook means for different people:
Landlords: Stable weekly rents around $590-$640, compressed yields of 3.6%-4.2%, and declining consents support holding strategies and selective reinvestment rather than rapid expansion.
Owner‑occupiers: Tight supply and strong demand reinforce long‑term value in core districts, with sales activity of 118-196 signalling active markets for those considering upgrading or relocating.
First‑home buyers: Affordability remains stretched, with typical lending settings requiring around $100,000 household income for a $750,000 home, but stable rents and slower new‑build pipelines create predictable conditions for planning entry.
Renters: Weekly rents remain steady at $590-$640 across most districts, but limited new supply and strong population bases mean competition for well‑located rentals remains high.
Summary:
Wellington City and Lower Hutt anchor the regional outlook, with weekly rents around $590-$595 and strong sales activity of 118-196 per month, reinforcing solid demand despite affordability pressures.
New‑build activity has fallen sharply, with regional consents down to an average of 32 per district, tightening future supply and supporting price stability across most markets.
Insurance costs and seismic risk remain influential, with Wellington carrying some of the highest premiums nationally, while transport upgrades and evolving policy settings continue to shape long‑term confidence and development feasibility.
Together, these dynamics show a Wellington market that remains demand‑led, supply‑tight, and shaped by structural factors such as insurance costs and transport investment-creating a stable but competitive environment for landlords heading into late 2026.
References
[1] Stats NZ. (2024). Household income statistics and regional data. Wellington, New Zealand: Stats NZ.
[2] Stats NZ. (2026). Rental price index and regional rent trends. Wellington, New Zealand: Stats NZ.
[3] MBIE. (2024). Building and construction sector trends. Wellington, New Zealand: Ministry of Business, Innovation and Employment.
[4] MBIE. (2026). Residential building consents: Regional breakdown. Wellington, New Zealand: Ministry of Business, Innovation and Employment.
[5] Opes Partners. (2026). Wellington house price update: Market movements and district trends. Christchurch, New Zealand: Opes Partners.
[6] Greater Wellington Regional Council. (2025). Transport investment and regional mobility improvements. Wellington, New Zealand: GWRC.
[7] Insurance Council of New Zealand. (2025). Regional insurance premiums and natural hazard risk. Wellington, New Zealand: ICNZ.
[8] Reserve Bank of New Zealand. (2023). Climate change and financial stability. Wellington, New Zealand: RBNZ.
[9] Reserve Bank of New Zealand. (2024). Financial Stability Report. Wellington, New Zealand: RBNZ.
[10] OECD. (2020). Transport infrastructure investment: Bridging divides. Paris, France: OECD Publishing.
[11] OECD. (2023). Housing market developments and policy implications. Paris, France: OECD Publishing.
[12] Demographia. (2024). International housing affordability report. Demographia.
The authors

Grant Foggo, Founder & CEO, Comprende
Grant Foggo has over 20 years of experience spanning the Middle East to Asia, he brings fresh thinking, entrepreneurial drive, and a deep passion for human connection. His leadership is built on innovation, growth, and making real relationships the foundation of business success. He’s constantly looking for ways to do things better and believes that the best thing for business is to put people first.

Graham Squires, Director, The Property Knowledge
admin@thepropertyknowledge.co.nz
Graham Squires is a Professor of Property Studies. He is the Author of 6 books and Editor of the Property Management Journal. Graham is a Fulbright Scholar and Director of the property research company The Property Knowledge.
Disclaimer: This work is provided for general guidance and informational purposes only and does not constitute legal, financial, or professional advice. The author(s) accept no responsibility or liability for any actions taken or decisions made based on this material.
Get in touch today. Call us on (04) 384 2141 or call in and see us at 16 The Terrace, Wellington.