Unsure whether to sell or rent out? Your postcode can make a difference.
Wellington Property Insights Report
March 2026.
A collaboration between Comprendé and The Property Knowledge.
Wellington’s property market is fragmented and it matters for anyone deciding whether to sell or rent out their property.
Wellington homeowners are facing a familiar but increasingly complex question: Is now the right time to sell, or is renting out your property the smarter move while the market finds its footing?
A new Property Insights report from Comprendé and The Property Knowledge reveals a region that has stabilised after years of volatility but is now adjusting unevenly. While house prices across Wellington have broadly levelled off, rental performance is diverging sharply and, in some districts, rental yields are improving. (Rental yield is calculated by dividing monthly rent by the monthly house price and multiplying by 100 to obtain a percentage).
Comprendé’s Grant Foggo says “The answer depends on your personal circumstances and where in Wellington you are. We’re seeing some districts stabilising, while others are softening, and a few are showing surprising late‑cycle strength. The relationship between prices, rents, population shifts, and supply trends is creating a landscape where the “right” decision varies sharply by district and suburb”.
Figure 1: Wellington house price by district (OCT, NOV, DEC 2025)
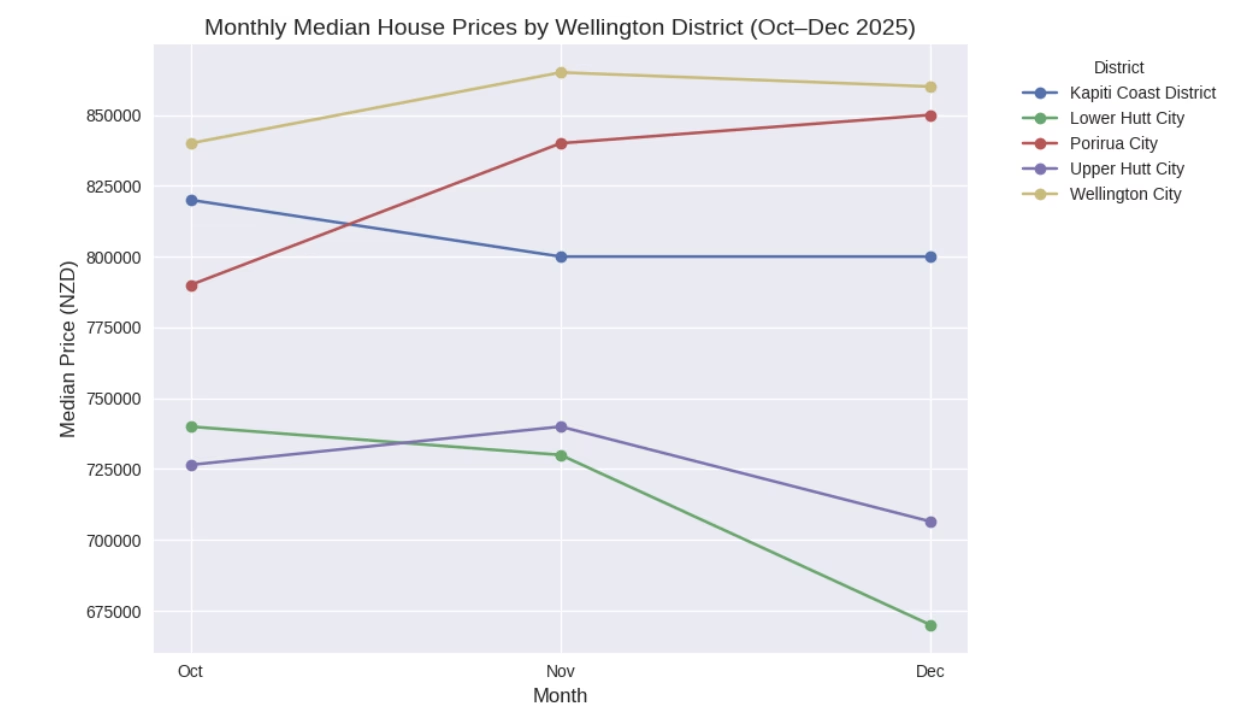
This growing divide between districts is creating very different outcomes for those weighing up whether to sell or rent their property.
The standout figure: Lower Hutt now delivers the strongest rental yield in the western Wellington region at 4.21%, outperforming Wellington City at 3.58%.
For Wellingtonians who own property, whether it’s the family home, a rental in the Hutt, or a coastal investment in Kāpiti, the message is clear: your postcode now matters more than ever.
Figure 2: Wellington district rental yields (2025)
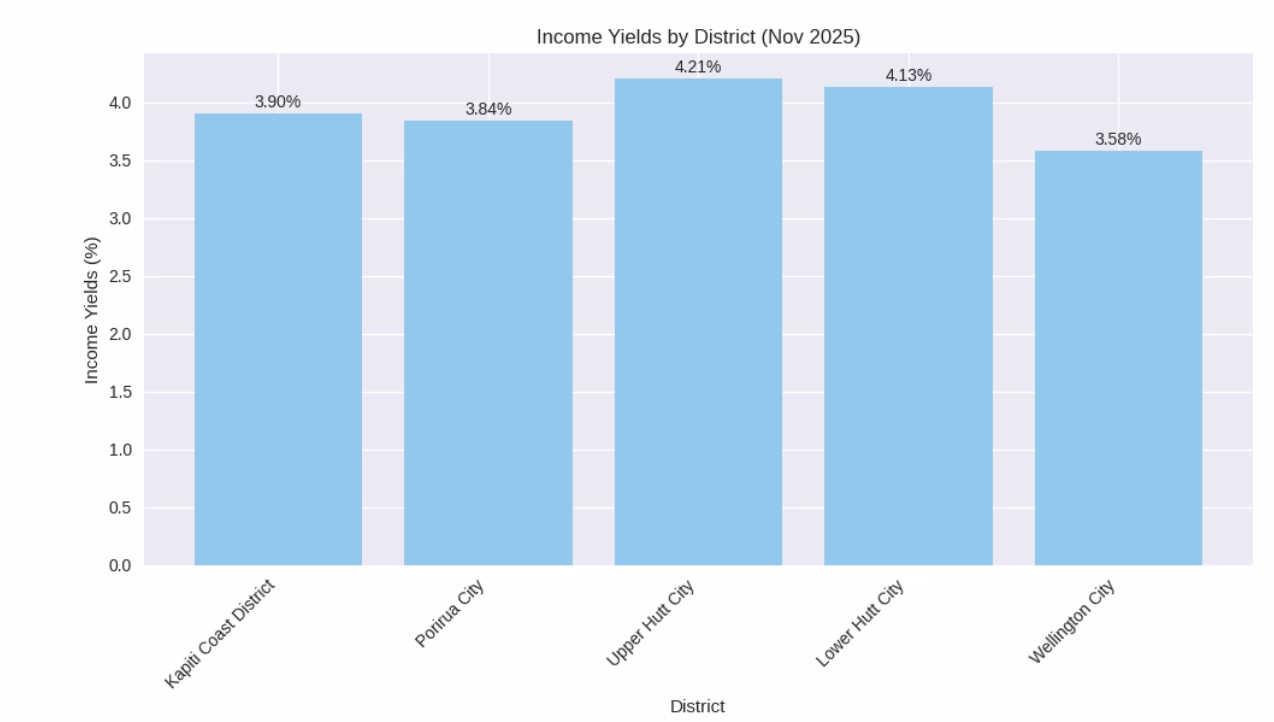
**The chart shows Income Yield (%) by District – Wellington Region, calculated as: Yield=(Monthly Rent×12 / House Price)×100. For Nov 2025. Source: MBIE and REINZ and The Property Knowledge
A market moving at different speeds
After tracking national swings through Covid and its aftermath, Wellington house prices have steadied. They haven’t rebounded but nor are they falling.
What has changed is the rhythm across districts.
- Wellington City remains the most expensive market, but rents softened late last year.
- Lower Hutt is combining steady demand with improving yield.
- Upper Hutt is stable and balanced.
- Porirua has plateaued at high rent levels.
- Kāpiti Coast continues a steady upward trajectory in both rents and population.
Foggo says the era of treating Wellington as a single housing market is over.
“Wellington’s property market is not moving as one region and that’s the key message for homeowners making sell-or-rent decisions,” says Foggo.
“The region is moving at different speeds. In some districts, having a rental property is delivering stronger returns than people might expect. In others, holding makes more sense than selling into a flat cycle. The opportunity now lies in district-specific decisions.”
Figure 3: Wellington region rent trends by district (2020–2025)
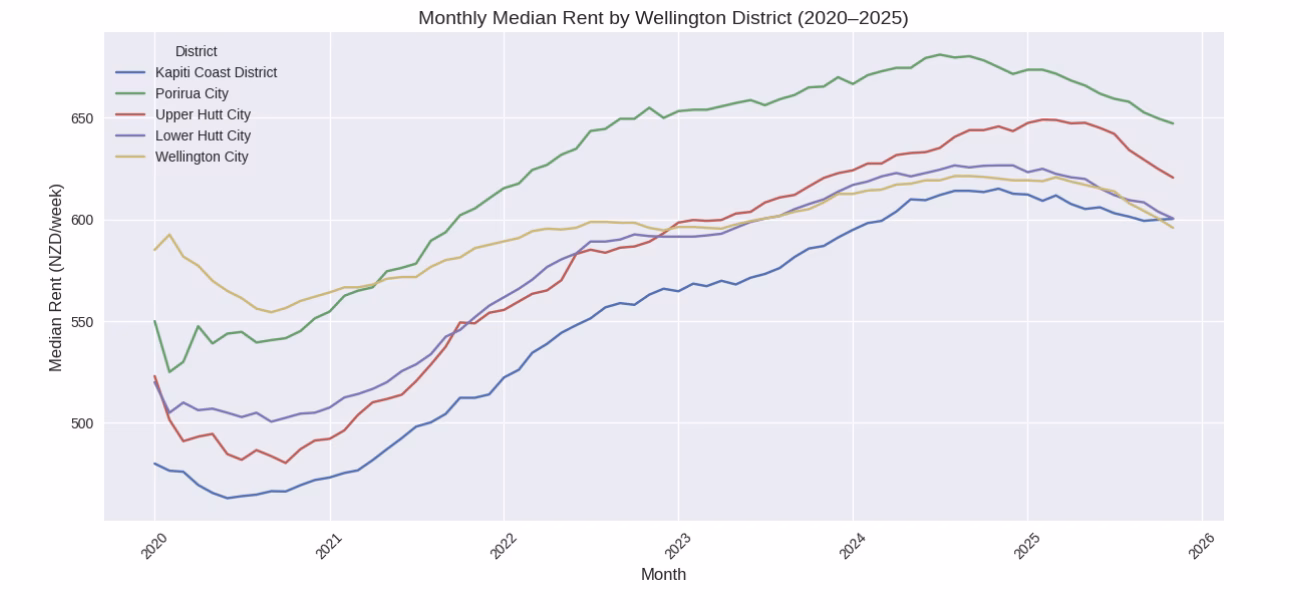
Rents are telling a different story to sale prices
While prices have flattened, rents are behaving very differently across the region.
Wellington City’s rental market has followed a shallower “falling-rising-falling” pattern since 2020, softening again in late 2025. In contrast, Kāpiti has shown steady upward movement, and Lower Hutt and Upper Hutt have delivered stronger relative yield positions.
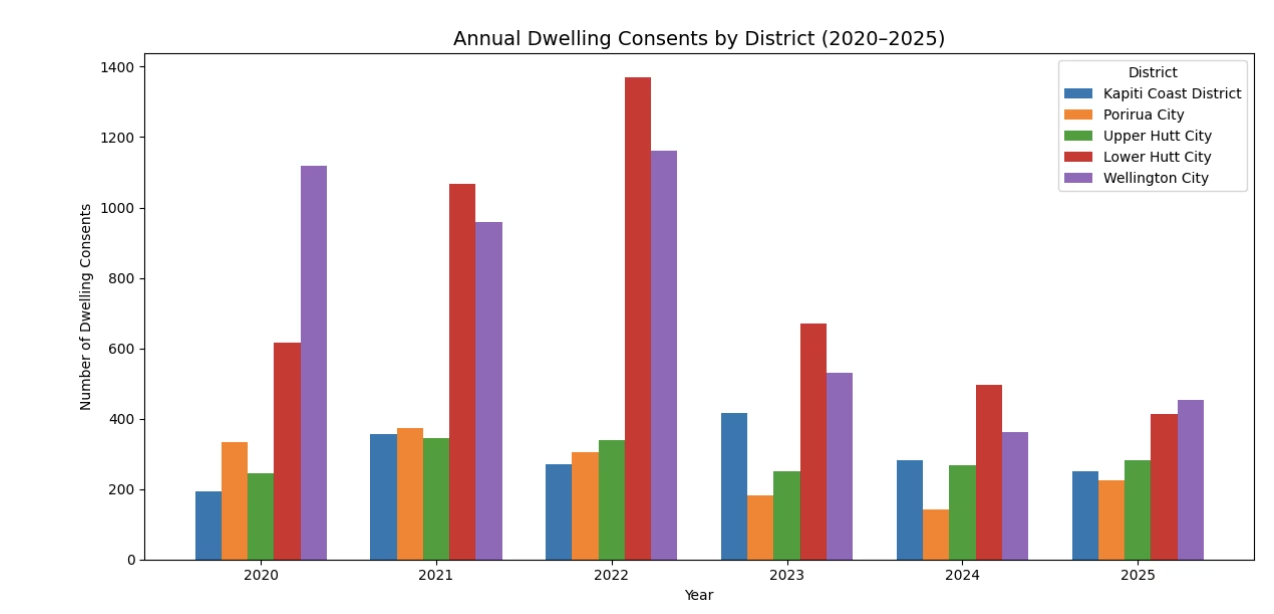
At the same time, new housing consents have dropped sharply since 2022, particularly in Wellington City and Lower Hutt, reducing the risk of oversupply in coming years. Fewer new builds typically means rental stability over the medium term.
Figure 4: Wellington district number of consents (2020–2025)
Professor Graham Squires, Director of The Property Knowledge, says this is a classic case of uneven market adjustment.
“What we’re seeing is spatially uneven market adjustment,” says Squires.
“Prices across the region have stabilised, but rents are moving in very different directions. That creates distinct sub-market behaviour. Lower Hutt’s 4.21% yield compared to Wellington City’s 3.58% is not a small gap – it materially changes the return profile for owners.”
“Rental performance is increasingly decoupled from price movements. Owners need to assess their decisions through both a regional and a district-level lens.”
Population and income shifts add to the complexity
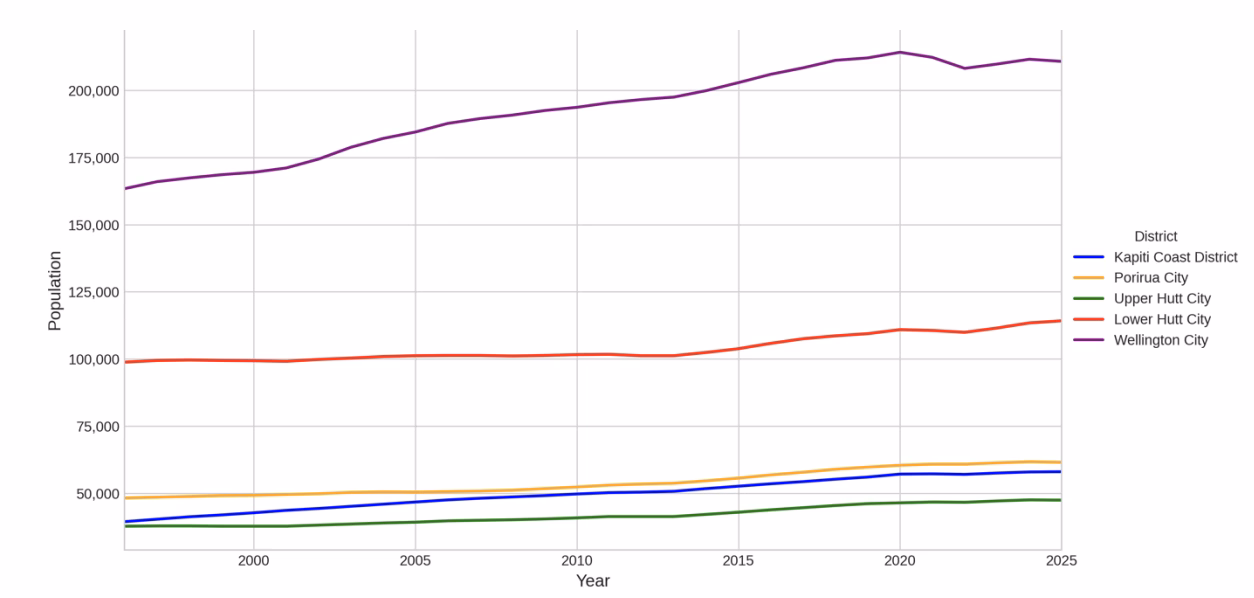
Wellington City remains the region’s population heavyweight at around 200,000 residents – approximately double the size of Lower Hutt. But it is no longer the dominant growth engine.
Lower Hutt has recorded population growth over the past five years, while growth elsewhere has been more uneven. At the same time, earnings growth in Wellington has flattened compared with Auckland and Canterbury, tempering rental demand in some areas.
Together, these forces are reshaping both short-term rental dynamics and longer-term capital growth prospects.
Figure 5: Wellington population by district (2020–2025)
What it means if you own property in Wellington
Wellington City
Softening rents and stabilising prices suggest many owners may be better placed holding and renting, particularly as new supply slows. The late-2025 dip looks cyclical rather than structural.
Lower Hutt
Currently the yield leader in the region. Population growth, stable demand and moderate price stability give owners flexibility. Renting offers attractive returns while selling may work for those repositioning assets.
Upper Hutt
Steady, balanced, and relatively low drama. A “hold and reassess” district with manageable supply and stable rents.
Porirua
High rents but currently plateauing. Well-located suburbs with strong transport links remain solid rental prospects.
Kāpiti Coast
One of the region’s most consistent performers, with steady rent and population growth. Renting and holding remains compelling unless owners are realising earlier gains.
The bottom line
After the overall property price decline we’ve seen over the past few years, Wellington has now split into ‘micro-markets’ with very different return profiles.
For homeowners, that means the old, region-wide narrative no longer applies. “Owners need to think local,” says Foggo. “This isn’t a market where you follow the overall regional trend, but one where you need to keep a close eye on the suburb and district of the property in question”.
And for many Wellington property owners, particularly outside the CBD, the data suggests renting your property out may currently offer more resilience and stronger short-term return than selling into a flat price cycle.
To see our full March Property report download here:
The Authors

Grant Foggo. CEO. Comprende
Grant@comprende.co.nz
Grant Foggo has over 20 years of experience spanning the Middle East to Asia, he brings fresh thinking, entrepreneurial drive, and a deep passion for human connection. His leadership is built on innovation, growth, and making real relationships the foundation of business success. He’s constantly looking for ways to do things better and believes that the best thing for business is to put people first.

Graham Squires. Director, The Property Knowledge
admin@thepropertyknowledge.co.nz
https://thepropertyknowledge.co.nz/
Graham Squires is a Professor of Property Studies. He is the Author of six books and Editor of the Property Management Journal. Graham is a Fulbright Scholar and Director of the property research company The Property Knowledge.
Disclaimer: This work is provided for general guidance and informational purposes only and does not constitute legal, financial, or professional advice. The author(s) accept no responsibility or liability for any actions taken or decisions made based on this material.
Call us or call in. (04) 384 2141. 16 The Terrace, Wellington.